
7.2 Visiting the Designer Dashboard

To support the analysis of your learning design, the Learning Design Studio (LDS) provided the Designer Dashboard featuring visualisations such as pie charts and heatmaps to illustrate how learning tasks interact with the overall design. It offers summary statistics to help users quickly identify patterns and imbalances in their design. Building on these insights, the dashboard will provide targeted feedback to guide further enhancements.

🌟 For guidance on the learning tasks, refer to Chapter 2.6 - Task Taxonomy.

A quick recap about the 4 types of task categories:
Directed Learning
, Exploratory Learning, Productive Learning, Reflective Learning

How can we ensure that students engage with different types of learning tasks to optimize their learning experience?

image.pngimage.png

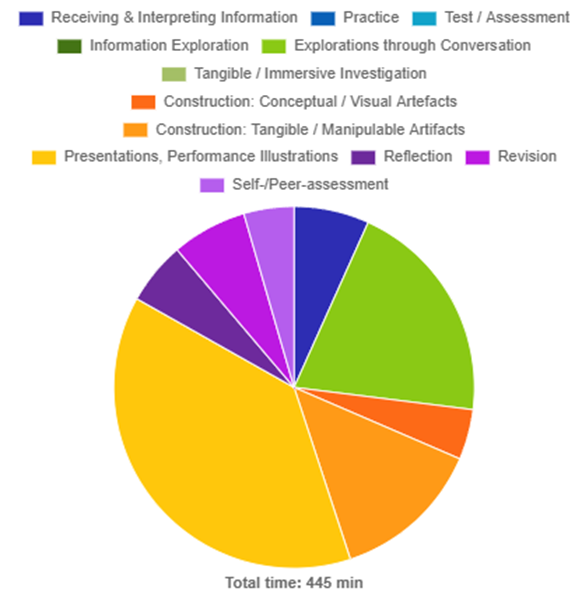
Figure 7.2: Designer Dashboard (1)

Distribution of time spent on learning task types


  • The total duration of learning time is 445 min.

  • 415 min (i.e.93%) out of this total duration is in-class time.

  • Top 3 learning time task types are Presentations, Performance Illustrations (38%),

  • Explorations through Conversation (20%),and Construction: Tangible / Manipulable Artifacts (13%).


This analysis focus on the time spent on learning task types. It shows the ratio of in-class to out-of-class activities. It also highlights the top task types through both text descriptions and color-coded segments in the pie chart, helping you quickly understand the overall distribution of learning tasks.


How can we ensure a comprehensive student learning experience by providing a balanced range and frequency of different learning tasks?

image.pngimage.png

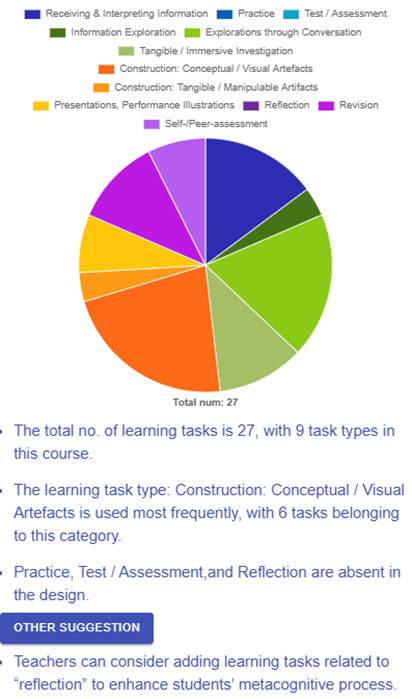
Figure 7.3: Designer Dashboard (2)

Distribution of number of learning task types:

  • The total no. of learning tasks is 27, with 9 task types in this course.

  • The learning task type: Construction: Conceptual / Visual Artefacts is used most frequently, with 6 tasks belonging to this category.

  • Practice, Test / Assessment, and Reflection are absent in the design.


Suggestion:

  • Teachers can consider adding learning tasks related to “test/assessment” to evaluate students’ understanding and proficiency in the subject matter.

  • Teachers can consider adding learning tasks related to “reflection” to enhance students’ metacognitive process.

  • Teachers can consider adding learning tasks related to “practice” to allow students to reinforce their skills and knowledge through repeated application.
This analysis focuses on the number of learning task types. It shows which task types are dominant and which are absent in the overall design. Additionally, it provides actionable feedback on adding specific tasks to enhance the design.
How can we design our assessment strategy to foster a more holistic development of skills, ensuring we evaluate not just application, but also analysis, evaluation, and creation?

image.pngimage.png

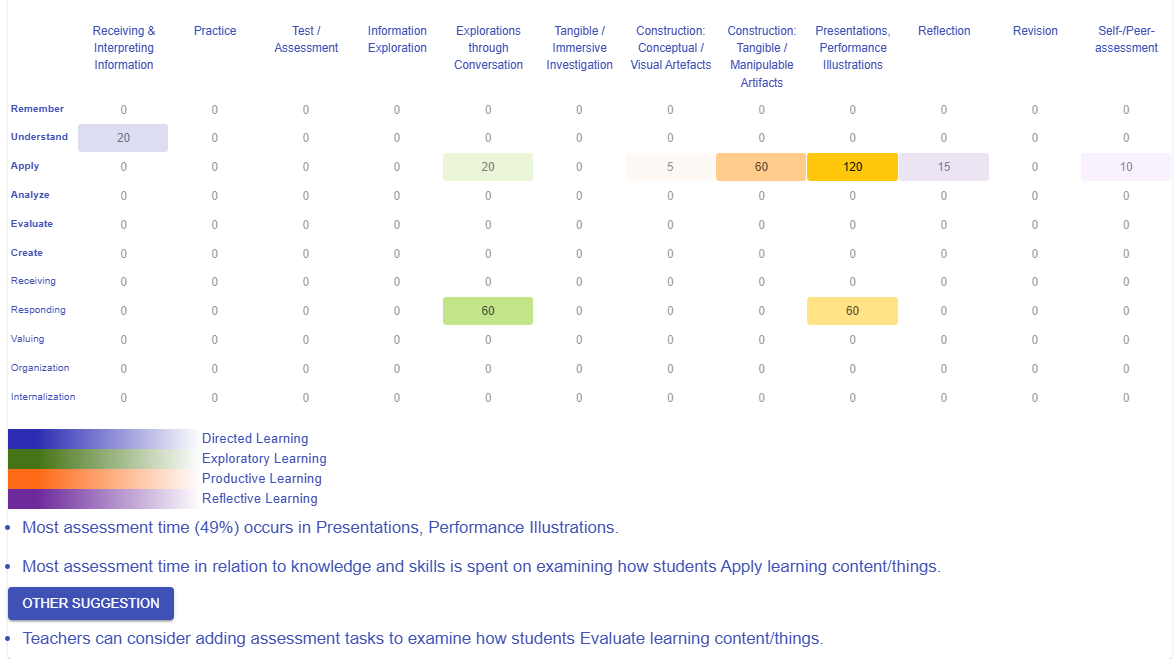
Figure 7.4: Designer Dashboard (3)


Heatmap of time spent on assessment tasks - LO level vs task category:

  • Most assessment time (49%) occurs in Presentations, Performance Illustrations.

  • Most assessment time in relation to knowledge and skills is spent on examining how students Apply learning content/things.


Suggestion:

  • Teachers can consider adding assessment tasks to examine how students Analyze learning content/things.
  • Teachers can consider adding assessment tasks to examine how students Evaluate learning content/things.


  • Teachers can consider adding assessment tasks to examine how students Create learning content/things.


This analysis works by mapping the time spent on different types of assessment tasks against various levels of learning outcomes. By visualizing this relationship, it helps identify which cognitive skills and affective skills are being most frequently assessed and which may be underrepresented. This insight enables educators to make informed decisions about how to diversify and balance their assessment strategies, ensuring that students are evaluated across a broader spectrum of learning outcomes—from basic understanding to higher-order thinking skills such as analysis, evaluation, and creation.
How can we ensure our use of social organization—individual, group, or whole class—is strategically matched to the cognitive demands of the task?

image.pngimage.png

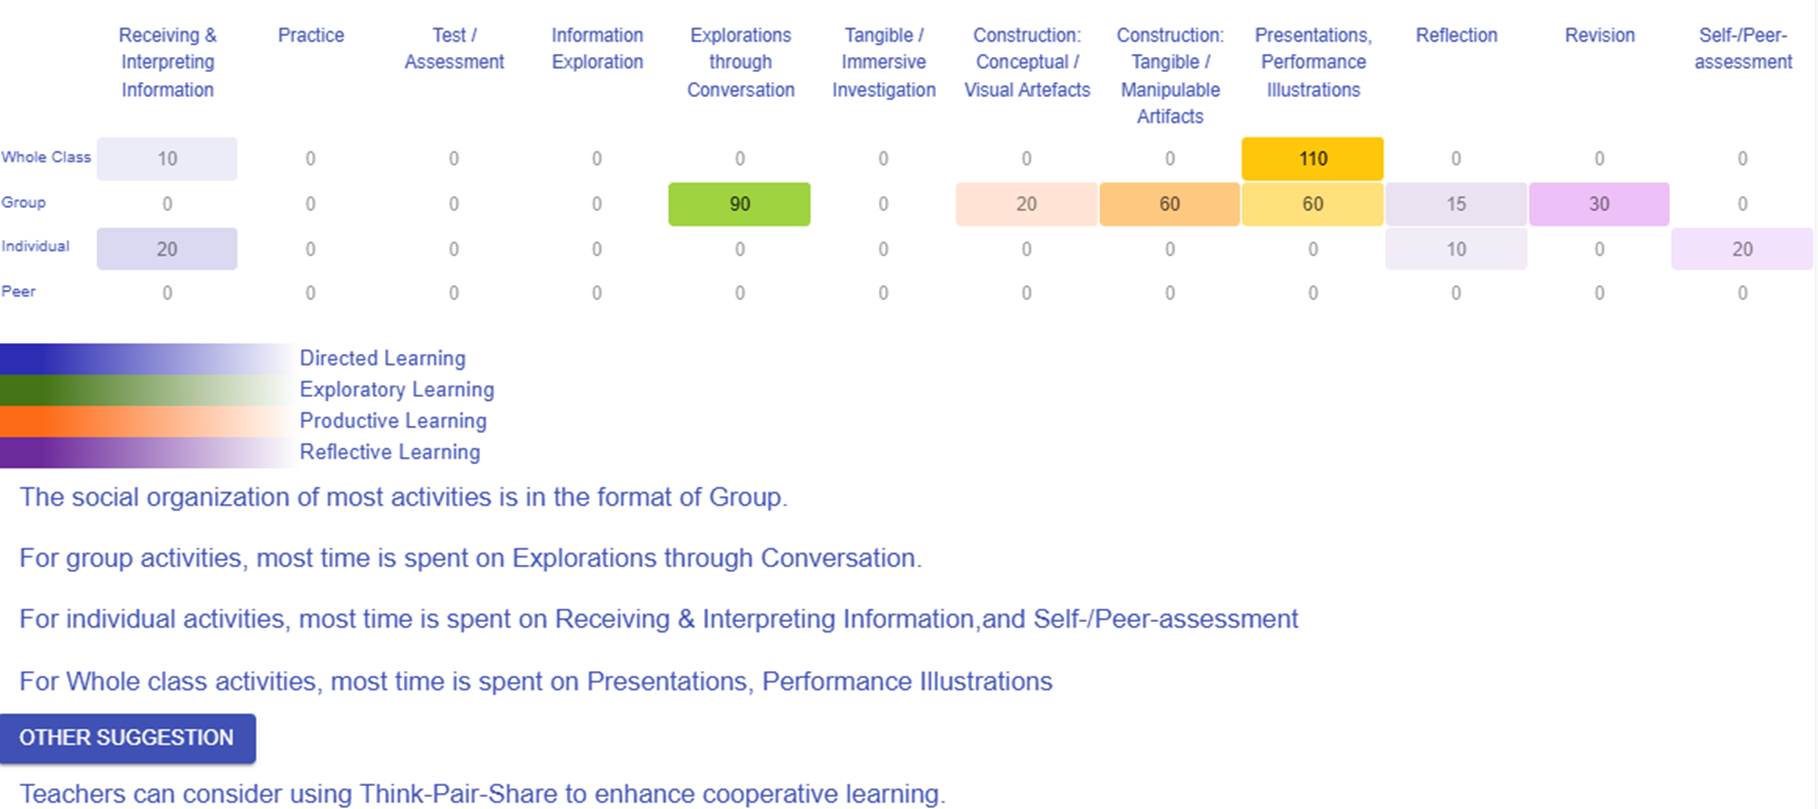
Figure 7.5: Designer Dashboard (4)


Heatmap of time spent on all tasks - social organization vs task type:

  • The social organization of most activities is in the format of Group.

  • For group activities, most time is spent on Explorations through Conversation.

  • For individual activities, most time is spent on Receiving & Interpreting Information, and Self-/Peer-assessment

  • For Whole class activities, most time is spent on Presentations, Performance Illustrations

Suggestion:

  • Teachers can consider using Think-Pair-Share to enhance cooperative learning.


This analysis examines how time is distributed across different task types within various social organization formats. It reveals which tasks dominate in each social setting and highlights opportunities to diversify engagement methods. 

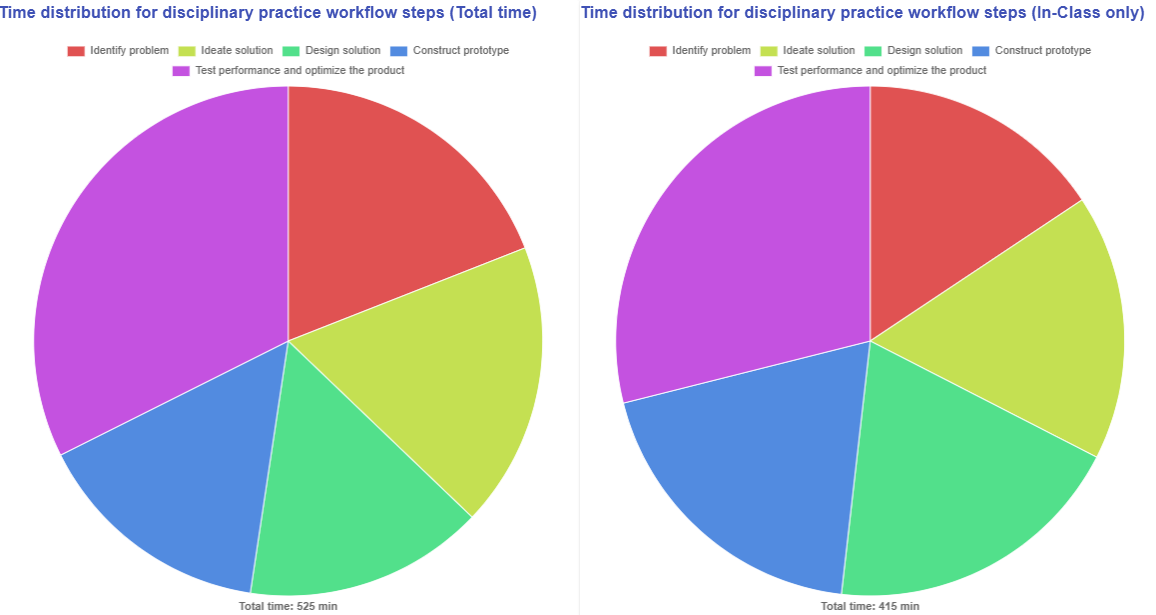
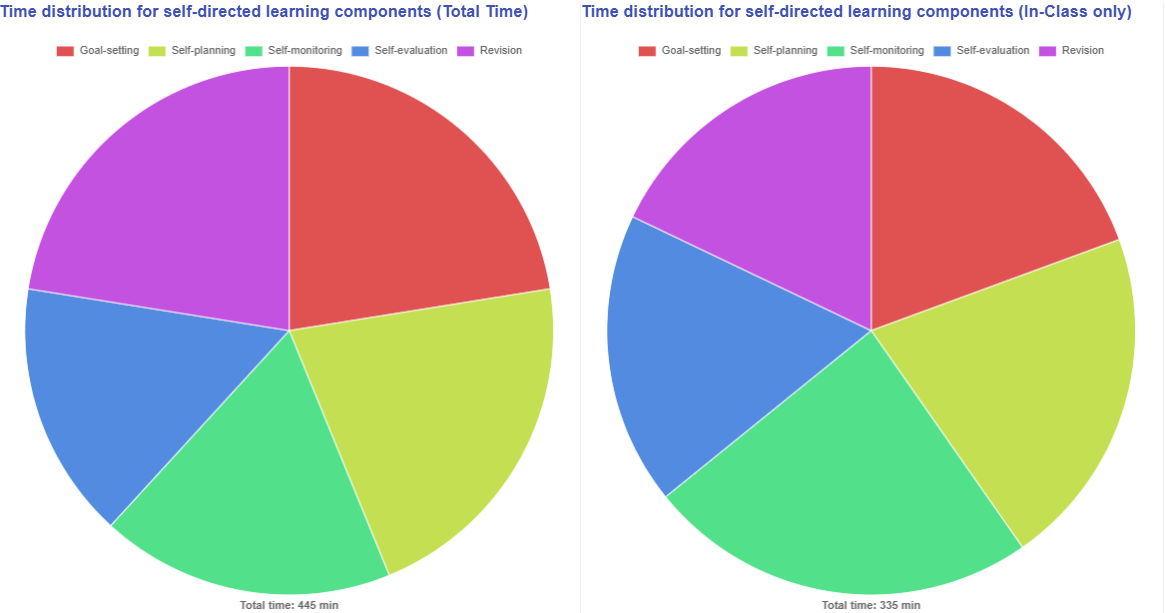
How do you organize your lesson time with respect to disciplinary practices and your chosen pedagogical approach?

image.pngimage.png

Figure 7.6: Designer Dashboard (5) - Disciplinary Practices


image.pngimage.png

Figure 7.7: Designer Dashboard (6) - Pedagogical Approach


The two diagrams above illustrate how the workflow steps of disciplinary practice and the pedagogical focus of the chosen pedagogical approach are arranged within your learning design. Additionally, the dashboard shows both the total time allocated for all learning tasks and the specific time dedicated to in-class activities, helping to ensure that the out-of-class workload remains manageable.